Notice
Best Practices for Reproducible Research part 2
- document 1 document 2 document 3
- niveau 1 niveau 2 niveau 3
Descriptif
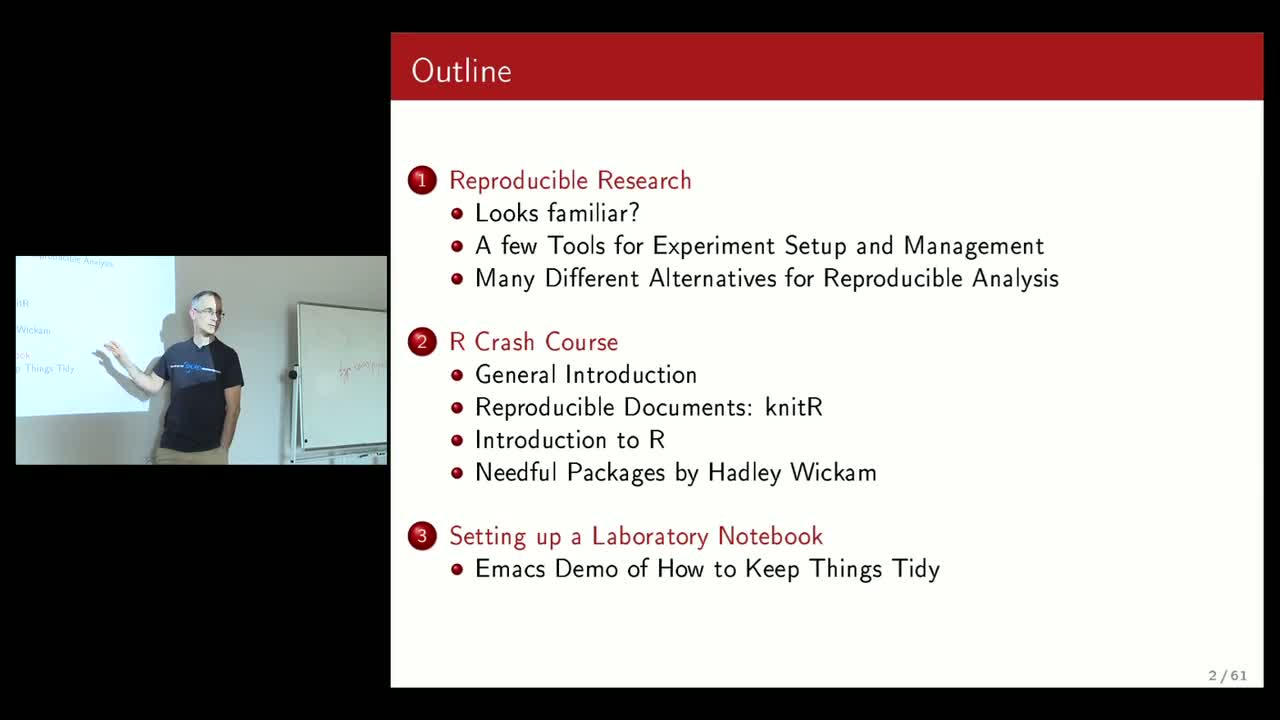
The aim of this tutorial is to sensibilize the audience to theexperiment and analysis reproducibility issue in particular incomputer science. I will present tools that help answering theanalysis problem and may also reveal useful for managing theexperimental process through notebooks.
More precisely, I will introduce the audience to the following tools:
- R and ggplot2 that provide a standard, efficient and flexibledata management and graph generation mechanism. Although R isquite cumbersome at first for computer scientists, it quicklyreveals an incredible asset compared to spreadsheets, gnuplot orgraphical libraries like matplotlib or tikz.
- knitR is a tool that enables to integrate R commands within aLaTeX or a Markdown document. It allows to fully automatize datapost-processing/analysis and figure generation down to theirintegration to a report. Beyond the gain in term of ease ofgeneration, page layout, uniformity insurance, such integrationallows anyone to easily check what has been done during theanalysis and possibly to improve graphs or analysis.
- I will explain how to use these tools with Rstudio, which is amulti-platform and easy-to-use IDE for R. For example, usingR+Markdown (Rmd files) in Rstudio, it is extremely easy toexport the output result to Rpubs and hence make the result ofyour research available to others in no more than two clicks.
- I will also mention other alternatives such as org-mode andbabel or the ipython notebook that allow a day-to-day practiceof reproducible research in a somehow more fluent way thanknitR but is mainly a matter of taste.
Depending on the question of the audience, I can also help theattendees analyzing some of their data and introduce them to thebasics of data analysis.
Intervention / Responsable scientifique
Dans la même collection
-
Simulation of HPC systems part 2
QuinsonMartinDegommeAugustinThe first part of the tutorial will present and contrast current experimental methodologies, giving attendees in-depth understanding of the scientific and technological issues at hand. The
-
Best Practices for Reproducible Research part 1
LegrandArnaudThe aim of this tutorial is to sensibilize the audience to the experiment and analysis reproducibility issue in particular in computer science. I will present tools that help answering the
-
Simulation of HPC systems part 1
QuinsonMartinDegommeAugustinThe first part of the tutorial will present and contrast current experimental methodologies, giving attendees in-depth understanding of the scientific and technological issues at hand. The
-
Instrumentation and Analysis part 2
Labarta ManchoJesusGonzalezJuanIn a first part, we will present the basics of tracing and what the major issues are. We will present some of the main tracing environments and try to compare them. We will focus on extrae and
-
Simulation of HPC systems part 3
QuinsonMartinDegommeAugustinThe first part of the tutorial will present and contrast current experimental methodologies, giving attendees in-depth understanding of the scientific and technological issues at hand. The
-
PUF/JLPC Summer school on performance Metrics, Modeling and Simulation of Large HPC Systems : intro…
LegrandArnaudIntroduction de La première école d'été du "Joint Laboratory for Petacale Computing focuses" qui s'est tenue à Sophia Antipolis, France du 12 au 13 juin 2014 avait pour thème : performance metrics,
-
Instrumentation and Analysis part 1
Labarta ManchoJesusGonzalezJuanIn a first part, we will present the basics of tracing and what the major issues are. We will present some of the main tracing environments and try to compare them. We will focus on extrae and
Avec les mêmes intervenants et intervenantes
-
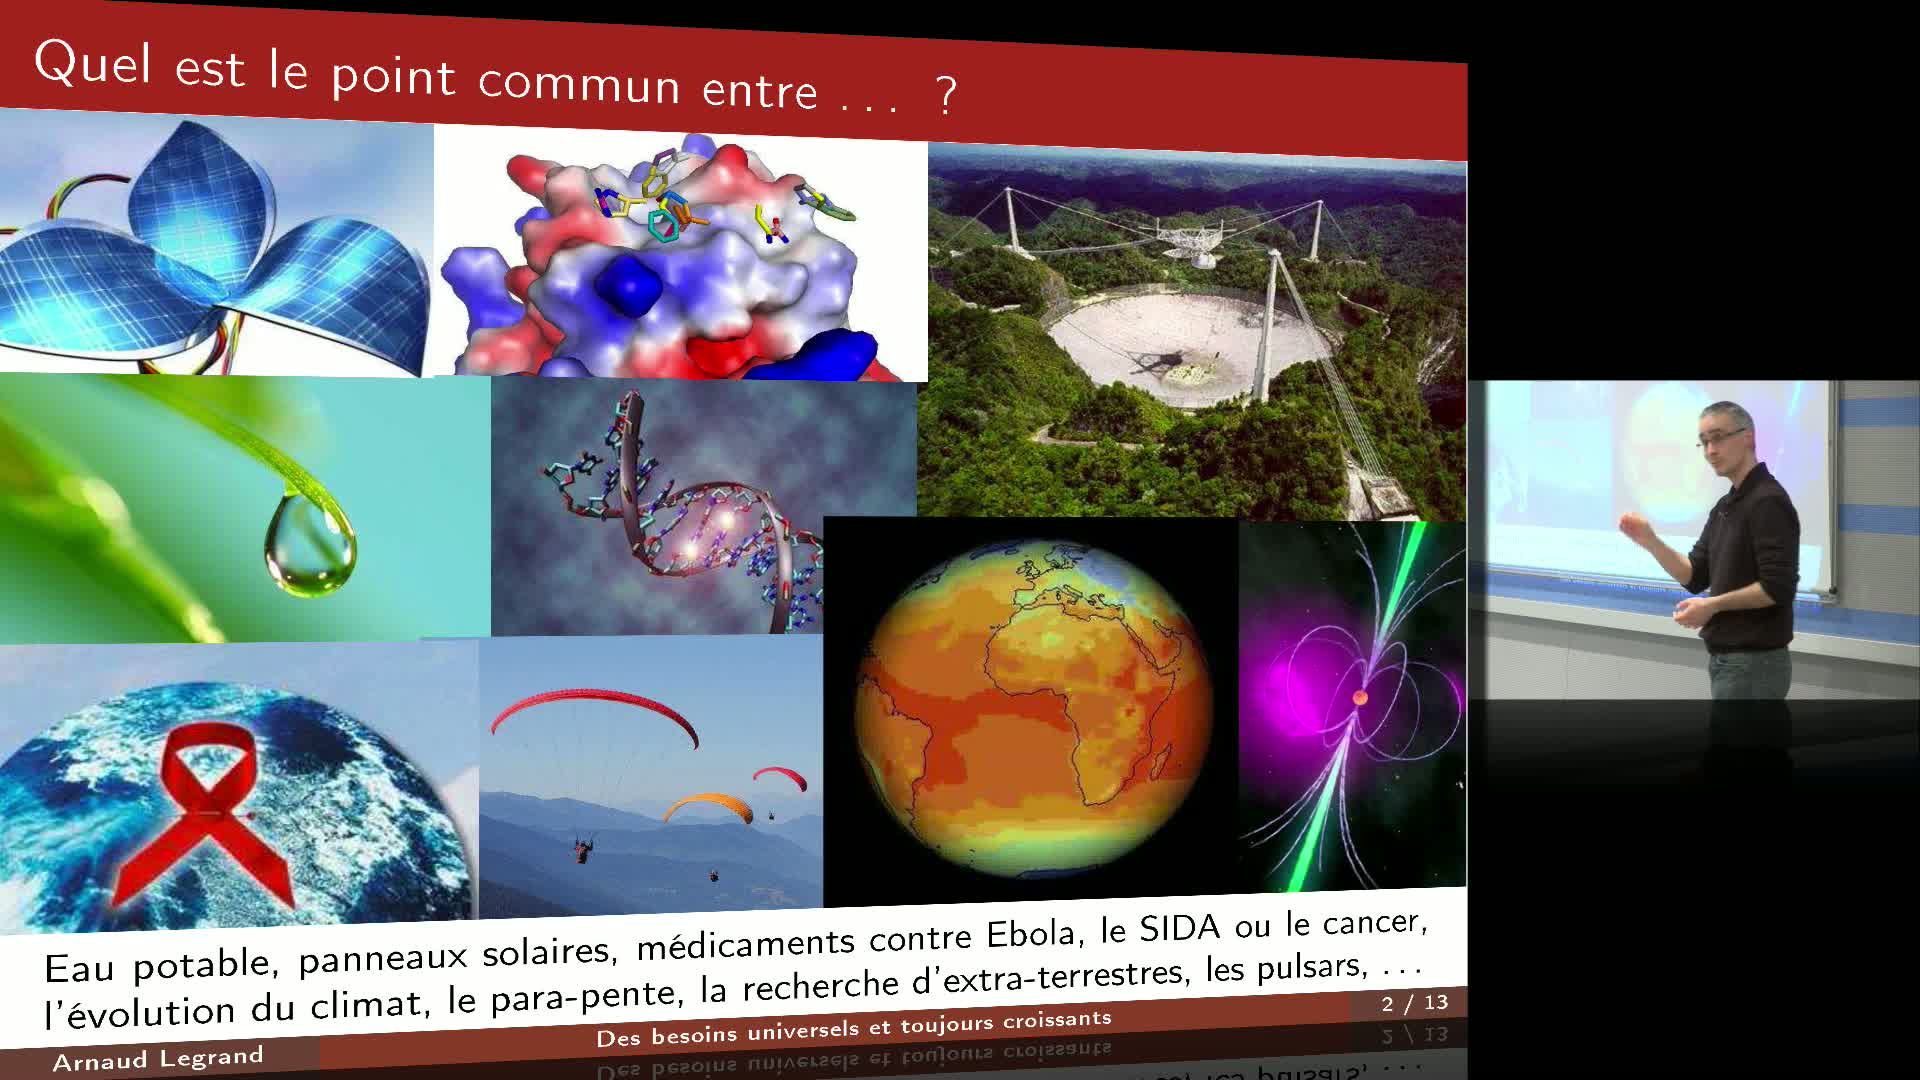
Grands systèmes informatiques
LegrandArnaudNotre société repose, parfois sans le savoir, sur de gigantesques infrastructures de calcul. À quoi ressemblent de telles machines, comment les utilise-t-on et quels sont les défis que cela pose ?
-
PUF/JLPC Summer school on performance Metrics, Modeling and Simulation of Large HPC Systems : intro…
LegrandArnaudIntroduction de La première école d'été du "Joint Laboratory for Petacale Computing focuses" qui s'est tenue à Sophia Antipolis, France du 12 au 13 juin 2014 avait pour thème : performance metrics,
-
Best Practices for Reproducible Research part 1
LegrandArnaudThe aim of this tutorial is to sensibilize the audience to the experiment and analysis reproducibility issue in particular in computer science. I will present tools that help answering the