Notice
ZA Timeline: Visualizing SES trajectory data on a timeline
- document 1 document 2 document 3
- niveau 1 niveau 2 niveau 3
Descriptif
5ecolloque des Zones Ateliers – CNRS
2000-2020, 20 ans de recherche du Réseau des Zones Ateliers
SESSION 4 : Concepts et outils pour le suivi des socio-écosystèmes
ZA Timeline: Visualizing SES trajectory data on a timeline (ZA Environnementale Urbaine)
Isabelle Charpentier ∗ 2,1
2 Laboratoire dessciences de l’ingénieur, de l’informatique et de l’imagerie (ICube) – Université de Strasbourg, CNRS :UMR7357 – 2, rue Boussingault - F-67000 Strasbourg, France
1 LTSER France, Zone Atelier Environnementale Urbaine (ZAEU) – Add this neworganization – 3, rue de l’Argonne,F-67000 Strasbourg, France
Résumé
Spatio-temporal dataof biodiversity, populationor climate as well as socio-cultural mile- stones... are among the data collected by the French LongTerm Socio-Ecological Research(LTSER) network, namely Réseaudes Zones Ateliers (RZA), to capture biophysical and socio- logical processes occurring in the socio-ecosystems (SESs) understudy.
Several conceptual frameworks were proposed to analyze externaldrivers and practices that im- pactand modify SES components such as stocks, processes,ecosystemic servicesor disservices. Among them, timelines are particular representation. As quotedin Sheps (wikipedia), the capi- tal use of the Charts is an excellent mechanical help to the knowledge of history, impressing the imagination indeliblywith a just image of the rise, progress, extent, duration, and contemporary state of all the considerable empires that have ever existed in the world.
Timelines are precious tools to:
+ report on data availability for the different proxies and theirindividual trend,
+ report on externalevents, or unusual facts,
+ facilitate the analysis of complex inter-relationships,
+ identify/justify data shortage,
+ invite researchers to fill the gaps.
The variety of data tells us about the scientific focus and expertise of the timeline produc- ers. Voids in the chart could indicate a lack of interdisciplinarity.
Drawing remainspainful. Very few software are proposed. Among them, OfficeTimeline pro builds on PowerPoint and formatted Excel spreadsheets. However, information that can be rep- resented remains limited,notably in terms of interactions.
The ZATimelinesoftware is a contribution to the analysisof SES trajectories based on data spreadsheets storingkey elements of the SES historyand time series availability. Data format iskeypoint. ZATimeline buildson Excel/Libreoffice spreadsheets to facilitate data management. Then, a dedicated, free of use, Matlab interface builds charts fromthese formatted spreadsheets. Format définition and representationare an ongoing work to be carriedout within the ATHN2 group.
”Easter island/Rapa Nui” SES is chosen as a case study. Firstly, data were collected in scientific reports for the period ranging from the Polynesian colonization to the European colonization (1200 - 1888) to figure out and analyzethe so-called ”collapse” hypothesis of "Easter Island".Secondly, data were collected in Spanish sources to document the historical period ranging from theChilean annexation to date (1888– 2020) in order to outline the environmental impactsof sheeps and touristson ”Isla de Pascua”. Third, researches were conducted using ”Rapa Nui” as a keyword to observe the contemporary phase and their re-appropriation of land and culture.
ZATimeline operated on Easter Island/Isla de Pascua/Rapa Nui clearly figures Human-Natureinteractions and notably tippingpoints in EasterIsland governance,cultual and culturalprac- tices, populations (human, flora, fauna), climateand their interrelations.
This software is currently used in 6 research projects carried out by 4 ZA.
--
Programme et recueil des résumés à télécharger dans l'onglet documents ci-dessus.
Toutes les informations sur le site du colloque :
https://20ans-rza.sciencesconf.org/resource/page/id/5
Dans la même collection
-
Session 4 : Communications posters
5e colloque des Zones Ateliers – CNRS 2000-2020, 20 ans de recherche du Réseau des Zones Ateliers SESSION 4 : Concepts et outils pour le suivi des socio-écosystèmes Communications posters Le
-
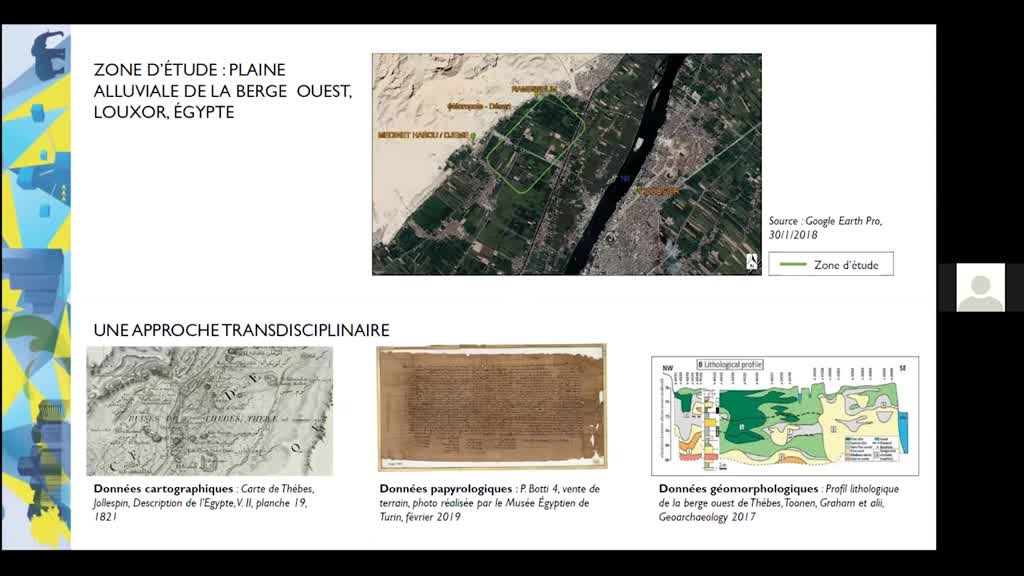
Coupler modèles hydrologiques distribués et modèles multi-agents: l'expérience du Buech
5e colloque des Zones Ateliers – CNRS 2000-2020, 20 ans de recherche du Réseau des Zones Ateliers SESSION 4 : Concepts et outils pour le suivi des socio-écosystèmes Coupler modèles
-
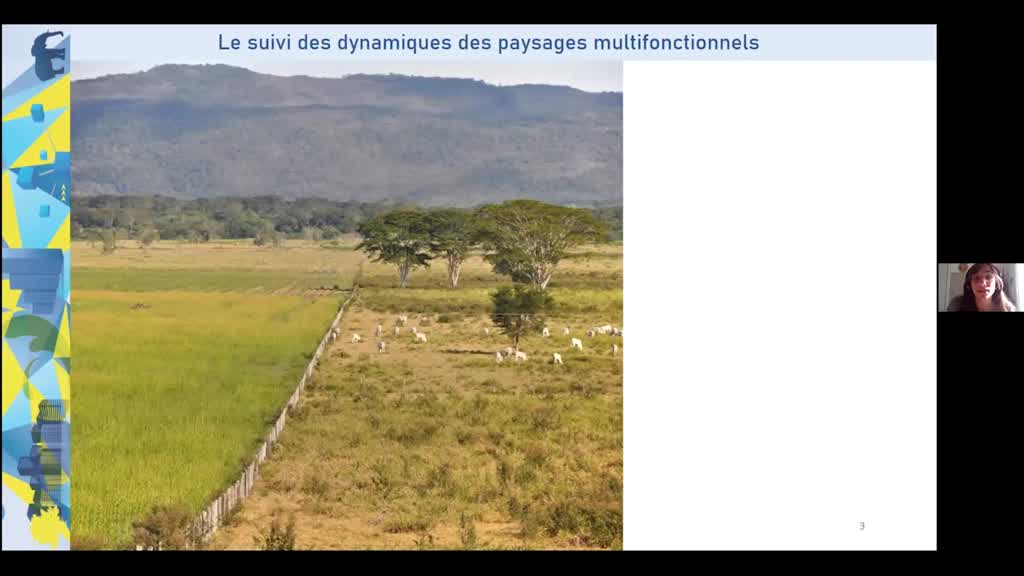
Une approche spatiale intégrée pour caractériser et suivre les dynamiques paysagères des socio-écos…
5e colloque des Zones Ateliers – CNRS 2000-2020, 20 ans de recherche du Réseau des Zones Ateliers SESSION 4 : Concepts et outils pour le suivi des socio-écosystèmes Une approche spatiale
-
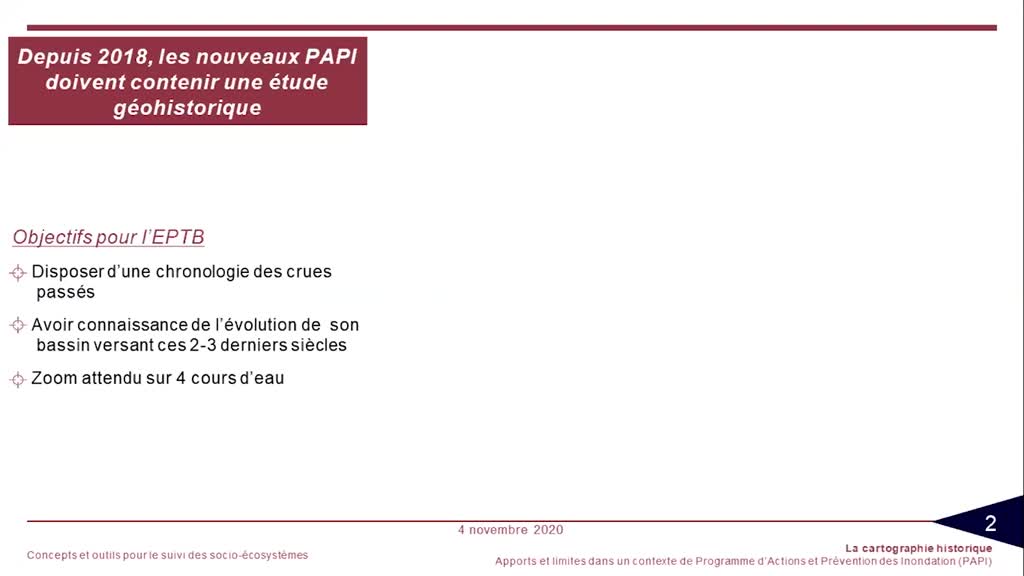
La cartographie historique : apports et limites dans un contexte de Programme d'Action etde Préven…
5e colloque des Zones Ateliers – CNRS 2000-2020, 20 ans de recherche du Réseau des Zones Ateliers SESSION 4 : Concepts et outils pour le suivi des socio-écosystèmes La cartographie
-
Localiser les prédateurs pour protéger les écosystèmes de l'Océan Austral
SESSION 4 : Concepts et outils pour le suivi des socio-écosystèmes